Quality Control
controls_report (a color-coded spreadsheet of control probe performance per sample)
methylcheck is geared toward quality control of processed data. To this end, there is a helpful function that summarizes performance of control probes (details on control probes here). To run this function, the control_probes.pkl file output from methylprep is required. This
report ensures that the chemistry (bisulfite conversion, target specificity, hybridization, staining, etc.) and machine readings are acceptable.
There is an optional portion of this report that relies on values from the poobah file as well. If no poobah file is present, this part is ignored.
Check the guide linked above for more information on how to read these reports. They’re intuitively color-coded (green = passing, red = failing, yellow = somewhere in between) so they’re easy to read at a glance. There is a colorblind-friendly option included in this function.
We’ll walk through examples of the QC pipeline using pre-processed, filtered data (see the Filtering Probes page).
[1]:
import methylcheck
from pathlib import Path
filepath = Path('/Users/patriciagirardi/tutorial/GPL21145')
[2]:
df, metadata = methylcheck.load_both(filepath=filepath)
metadata.head()
INFO:methylcheck.load_processed:Found several meta_data files; attempting to match each with its respective beta_values files in same folders.
WARNING:methylcheck.load_processed:Columns in sample sheet meta data files does not match for these files and cannot be combined:['/Users/patriciagirardi/tutorial/GPL21145/GSE147391_GPL21145_meta_data.pkl', '/Users/patriciagirardi/tutorial/GPL21145/sample_sheet_meta_data.pkl']
INFO:methylcheck.load_processed:Multiple meta_data found. Only loading the first file.
INFO:methylcheck.load_processed:Loading 16 samples.
Files: 100%|██████████| 1/1 [00:00<00:00,  5.07it/s]
INFO:methylcheck.load_processed:loaded data (865859, 16) from 1 pickled files (0.223s)
INFO:methylcheck.load_processed:meta.Sample_IDs match data.index (OK)
[2]:
| GSM_ID | Sample_Name | Sentrix_ID | Sentrix_Position | source | histological diagnosis | description | Sample_ID | |
|---|---|---|---|---|---|---|---|---|
| 2 | GSM4429898 | Grade II rep3 | 203163220027 | R01C01 | Resected glioma | Diffuse astrocytoma (II) | Glioma | 203163220027_R01C01 |
| 3 | GSM4429899 | Grade III rep1 | 203163220027 | R02C01 | Resected glioma | Anaplastic astrocytoma (III) | Glioma | 203163220027_R02C01 |
| 12 | GSM4429908 | Grade IV rep5 | 203163220027 | R03C01 | Resected glioma | Glioblastoma (IV) | Glioma | 203163220027_R03C01 |
| 15 | GSM4429911 | Grade IV rep8 | 203163220027 | R04C01 | Resected glioma | Glioblastoma (IV) | Glioma | 203163220027_R04C01 |
| 6 | GSM4429902 | Grade II rep6 | 203163220027 | R05C01 | Resected glioma | Oligodendroglioma (II) | Glioma | 203163220027_R05C01 |
[3]:
methylcheck.controls_report(filepath=filepath)
INFO:methylprep.files.manifests:Reading manifest file: MethylationEPIC_v-1-0_B4.CoreColumns.csv
203175700025_R01C01 GA r=0.81 ±0.23 p<0.0 |CT r=0.82 ±0.15 p<0.0
203175700025_R02C01 GA r=0.9 ±0.16 p<0.0 |CT r=0.87 ±0.13 p<0.0
203163220027_R01C01 GA r=0.86 ±0.19 p<0.0 |CT r=0.83 ±0.14 p<0.0
203163220027_R02C01 GA r=0.88 ±0.16 p<0.0 |CT r=0.85 ±0.13 p<0.0
203175700025_R05C01 GA r=0.87 ±0.14 p<0.0 |CT r=0.84 ±0.11 p<0.0
203175700025_R06C01 GA r=0.91 ±0.12 p<0.0 |CT r=0.87 ±0.1 p<0.0
203163220027_R05C01 GA r=0.87 ±0.16 p<0.0 |CT r=0.85 ±0.12 p<0.0
203163220027_R06C01 GA r=0.9 ±0.14 p<0.0 |CT r=0.85 ±0.12 p<0.0
203175700025_R03C01 GA r=0.85 ±0.17 p<0.0 |CT r=0.85 ±0.13 p<0.0
203175700025_R04C01 GA r=0.87 ±0.15 p<0.0 |CT r=0.87 ±0.11 p<0.0
203175700025_R07C01 GA r=0.88 ±0.13 p<0.0 |CT r=0.85 ±0.11 p<0.0
203175700025_R08C01 GA r=0.9 ±0.13 p<0.0 |CT r=0.87 ±0.1 p<0.0
203163220027_R03C01 GA r=0.84 ±0.17 p<0.0 |CT r=0.83 ±0.13 p<0.0
203163220027_R07C01 GA r=0.85 ±0.16 p<0.0 |CT r=0.86 ±0.11 p<0.0
203163220027_R08C01 GA r=0.87 ±0.15 p<0.0 |CT r=0.85 ±0.12 p<0.0
INFO:methylcheck.reports.controls_report:Predicting Sex...
INFO:methylprep.files.manifests:Reading manifest file: MethylationEPIC_v-1-0_B4.CoreColumns.csv
203163220027_R04C01 GA r=0.87 ±0.16 p<0.0 |CT r=0.87 ±0.12 p<0.0
(865859, 16) (865859, 16)
The color-coded results are contained in an excel file that will be saved in the same directory that was specified as an input. It will look similar to this: 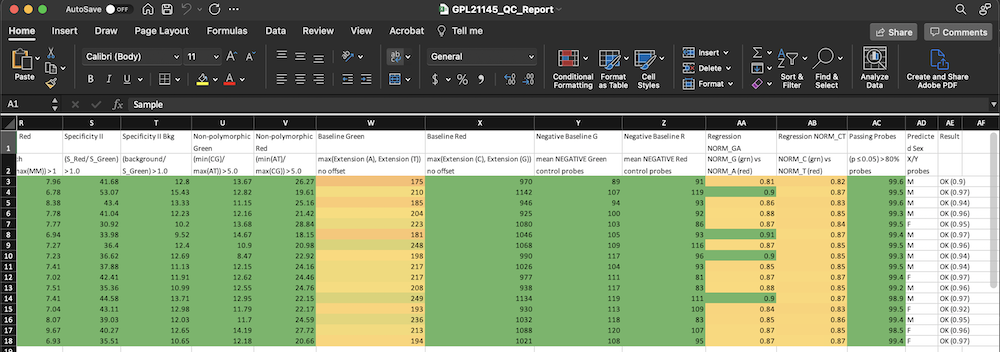 The “Passing Probes” column is the column that relies on values from the poobah file. This is a measure of how many probes failed in each sample (detection p-value > 0.05). The p-value cut off is adjustable with the
 pval_sig argument, which is set to 0.05 by default.
Notice the final column (“Result”) where most samples are passing. This column is calculated by checking that all of the QC columns are above a minimum threshold. This threshold is adjustable with the passing argument (set to 0.7 by default). - If the poobah file is included and 20% or more of probes fail, the Result is automatically FAIL. - If 70% of the columns are passing, the result is “OK” or passing. - If more than 70% are passing, but less than 100%, the “OK” will have a number next
to it to specify what percentage of columns passed. - If less than 70% of the columns passed, the result is either FAIL or MARGINAL (based on how close to the 70% threshold it got).
The predicted sex column is based on the median values of methylation measurements on the X and Y chromosomes. If yMed - xMed is less than whatever the specified cutoff value is, it is predicted female. Otherwise, the predicted sex is male. Also, for samples from female subjects, at least 90% of the Y chromosome probes should fail. If there is a sample sheet that includes “sex” or “gender”, the reporter will also flag any mismatches between the predicted sex and the specified sex (this does
not affect the Result column).
Quality Control in the IDE
If you want to run a quick quality control check within your CLI or IDE (with no output files saved), use the run_qc function. This is a simplified version of the full controls_report function.
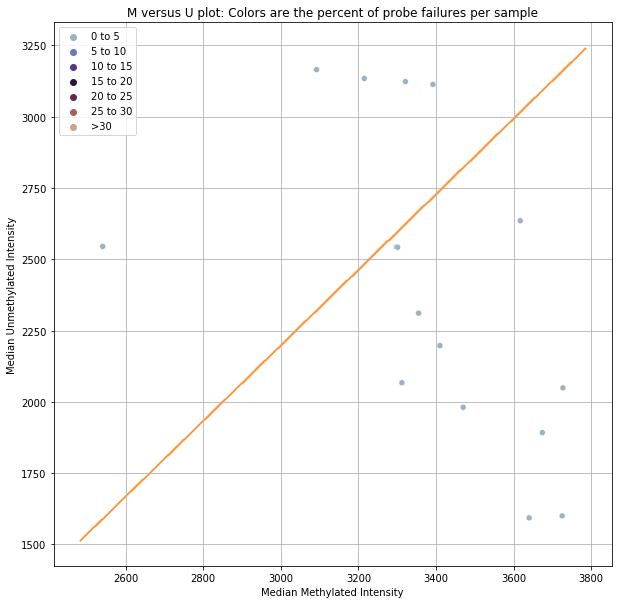
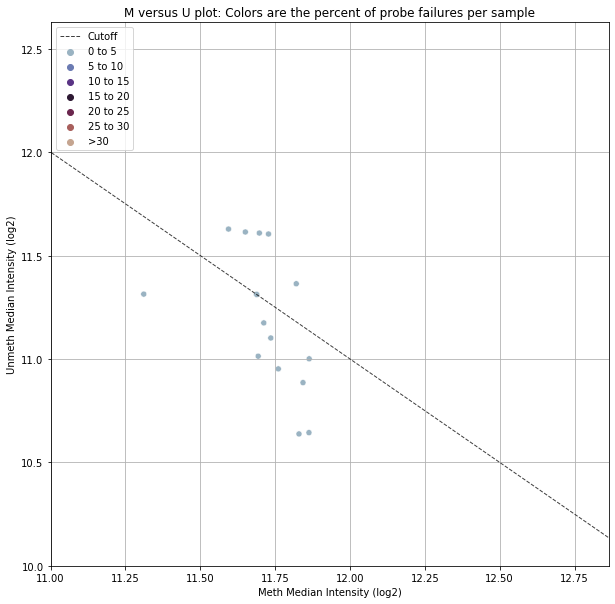
The first and second plots shown below are based on the qc_signal_intensity function, which suggests sample outliers based on methylated and unmethylated signal intensity. The cutoff value is based on minfi’s chosen cutoff value. If a sample falls below the dotted line in the second chart, it is potentially poor quality (due to low fluorescence). This is a very specific way of identifying poor quality samples and we recommend taking a more holistic approach (using controls_report()).
However, this can still be useful information in some circumstances, which is why we’ve included it in the original qc pipeline.
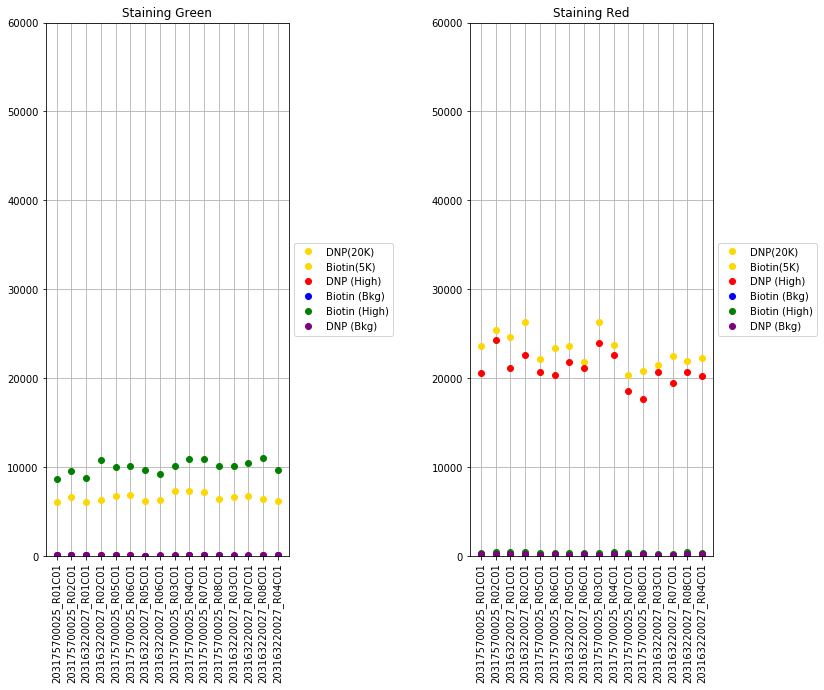
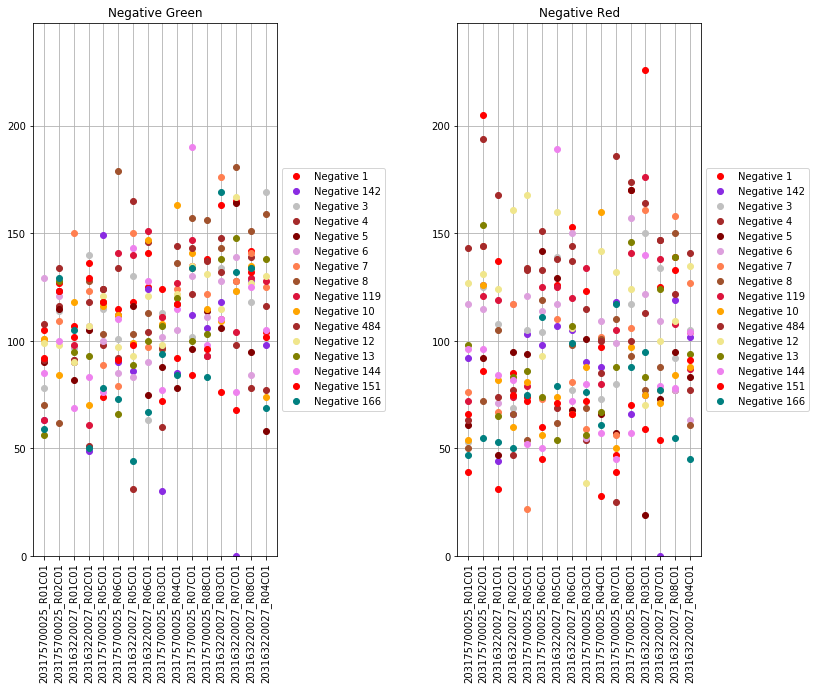
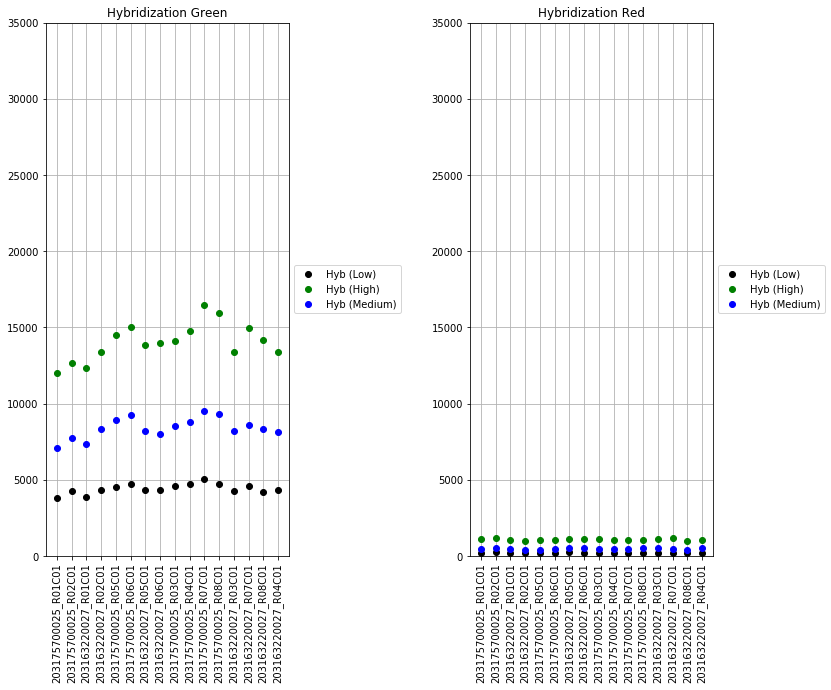
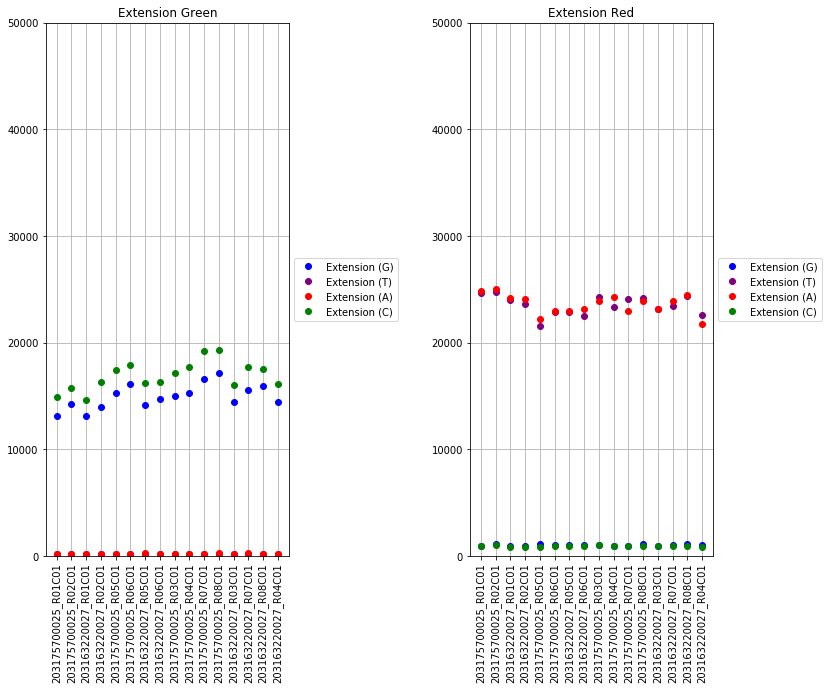
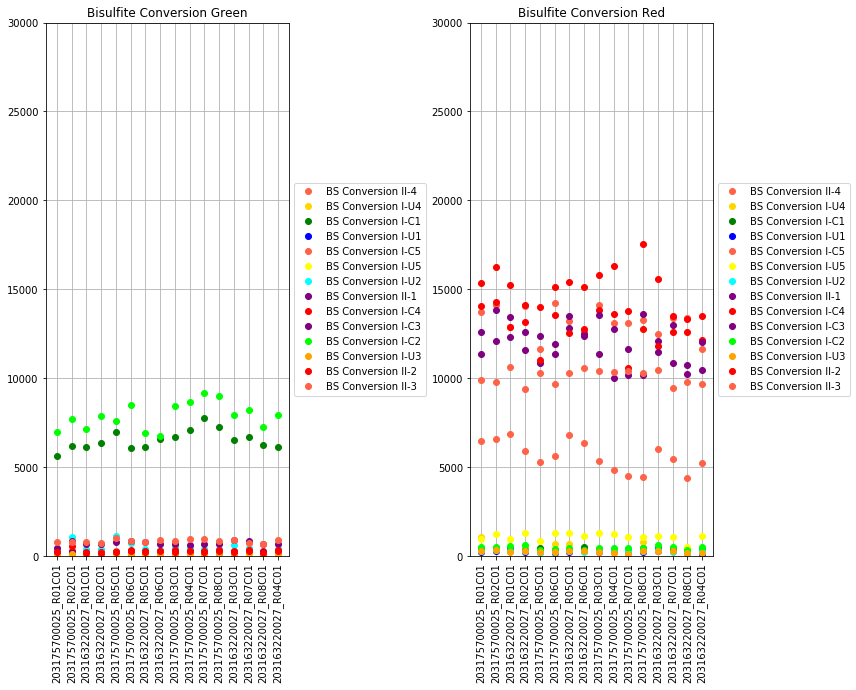
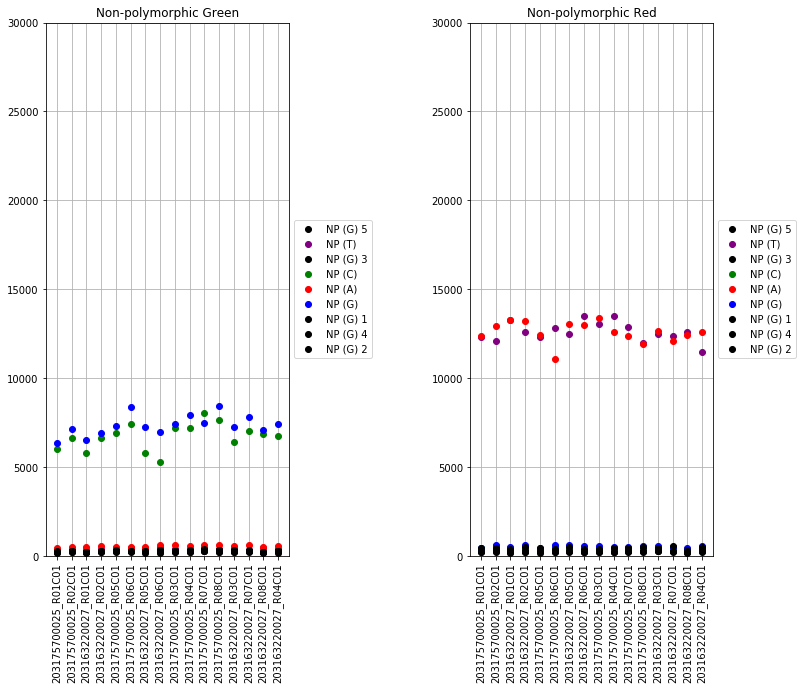
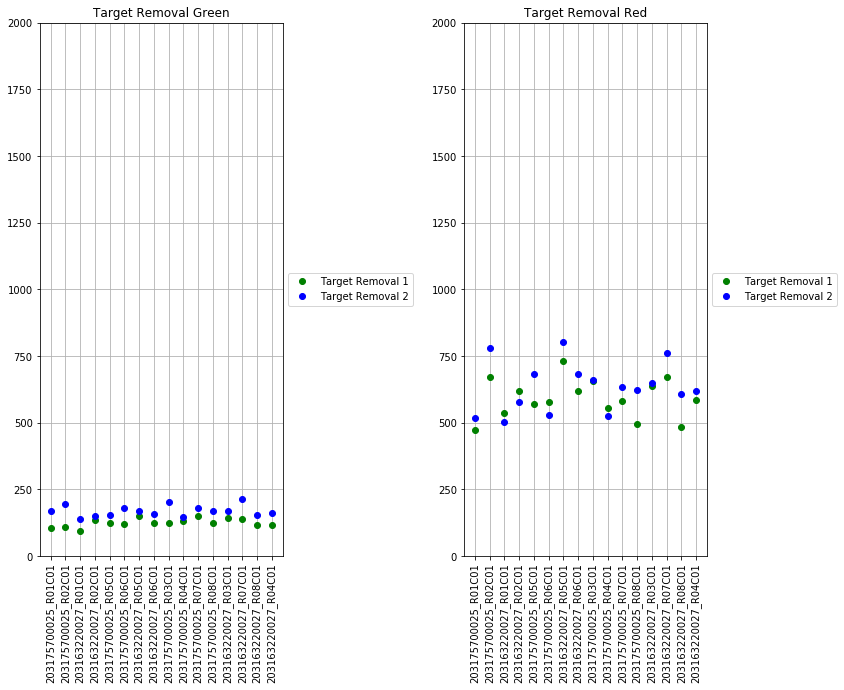
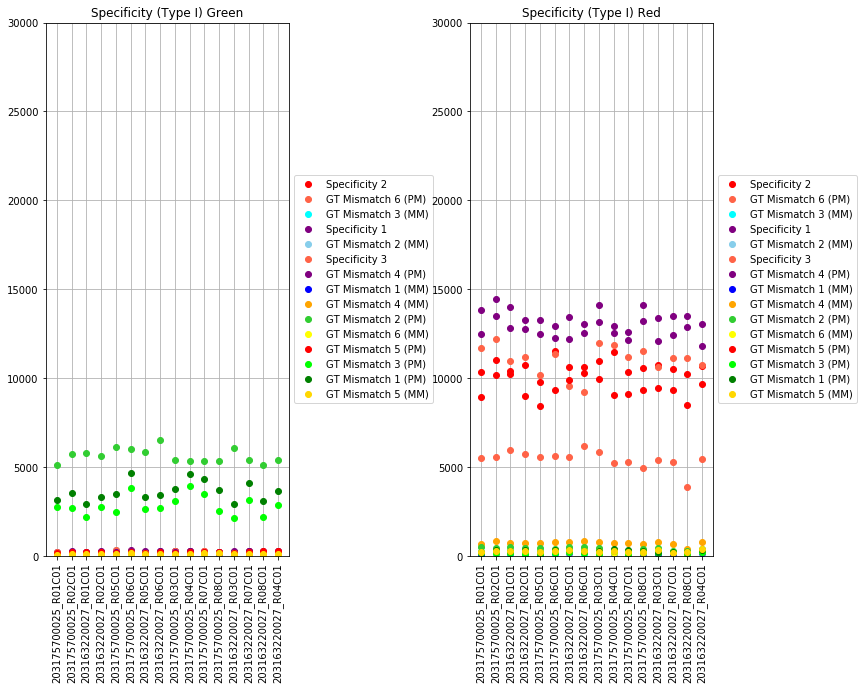
The next set of plots cover hybridization, staining, bisulfite conversion, specificity, target removal, extension, negative controls, and non-polymorphic binding, but can be more difficult to interpret in this graph format. For more, consult Illumina’s technical document on what the expected values for these graphs should be.
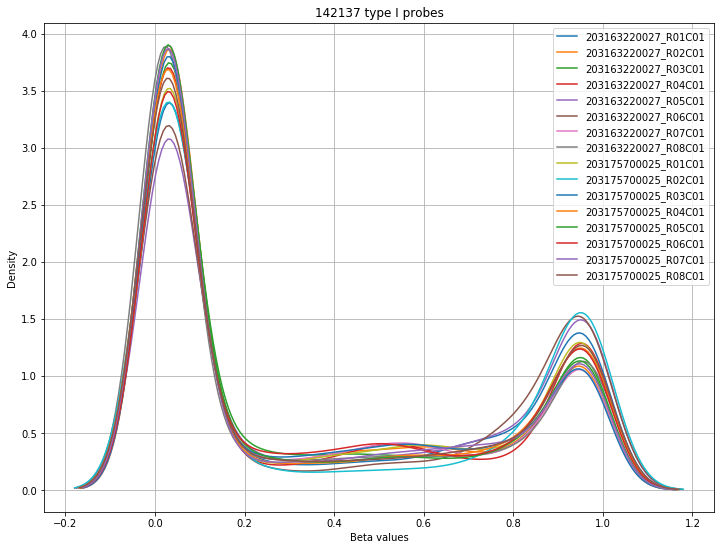
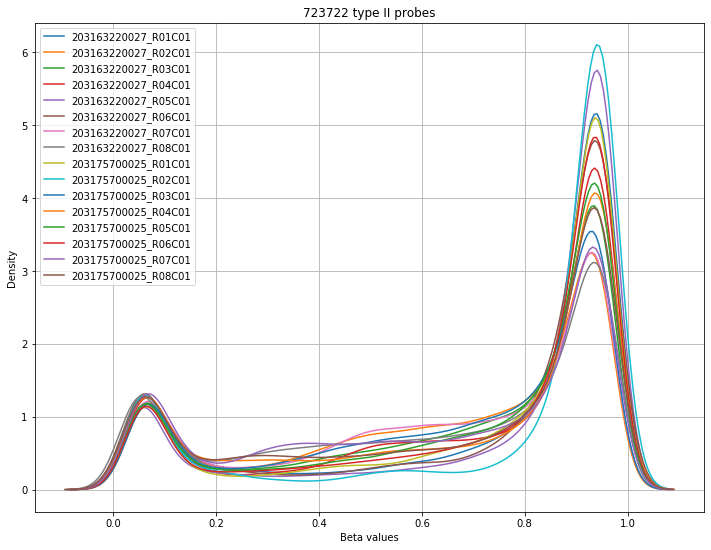
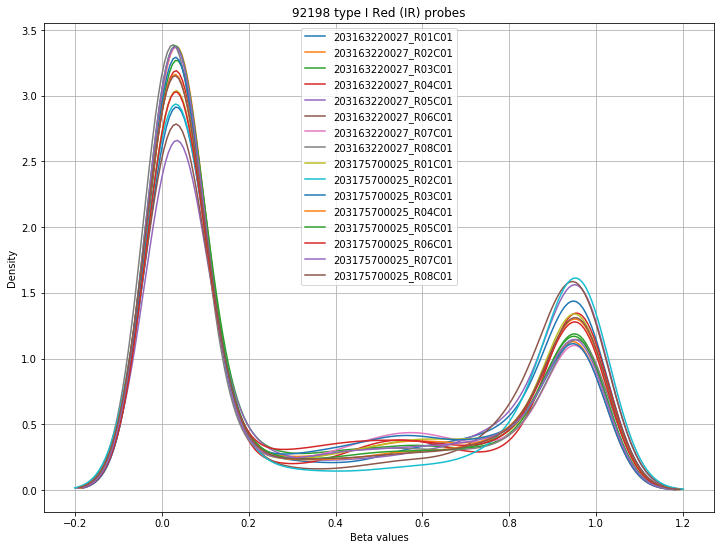
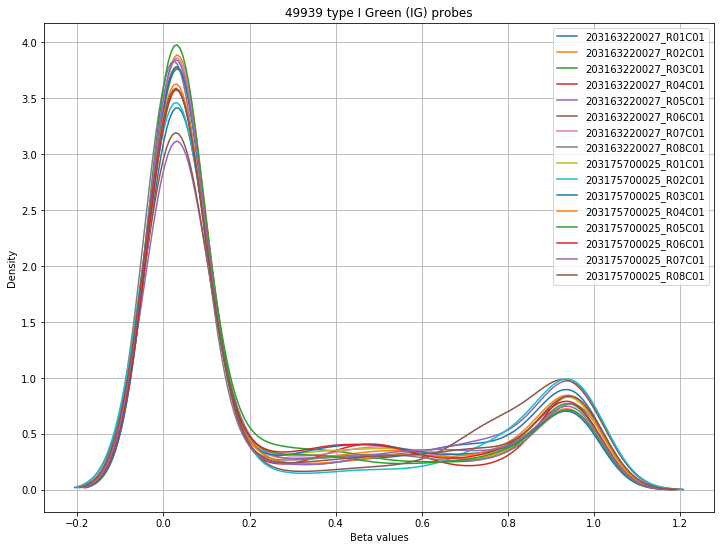
The final set of plots is beta distributions by probe type (Type I and Type II); the distributions of Type I probes are split by color channel as well.
This function is to be used before any removal of probes or samples. If you remove probes or samples from your beta value dataframe, this function will no longer run due to inconsitant rows and/or columns in other dataframes (such as m-value).
[4]:
methylcheck.run_qc(filepath)
List of Bad Samples
['203163220027_R01C01', '203163220027_R03C01', '203163220027_R04C01', '203163220027_R05C01', '203163220027_R06C01', '203163220027_R08C01', '203175700025_R01C01', '203175700025_R02C01', '203175700025_R05C01', '203175700025_R06C01']
INFO:methylprep.files.manifests:Reading manifest file: MethylationEPIC_v-1-0_B4.CoreColumns.csv
WARNING:methylcheck.samples.postprocessQC:Your data contains 21853 missing probe values per sample, (349658 overall). For a list per sample, use verbose=True
Found 142137 type I probes.
WARNING:methylcheck.samples.postprocessQC:Your data contains 89427 missing probe values per sample, (1430832 overall). For a list per sample, use verbose=True
Found 723722 type II probes.
WARNING:methylcheck.samples.postprocessQC:Your data contains 15076 missing probe values per sample, (241225 overall). For a list per sample, use verbose=True
Found 92198 type I Red (IR) probes.
WARNING:methylcheck.samples.postprocessQC:Your data contains 6777 missing probe values per sample, (108433 overall). For a list per sample, use verbose=True
Found 49939 type I Green (IG) probes.
Predicting Sex
If you want to predict the sex of your samples without generating the entire QC report, you need the methylated and unmethylated .pkl files generated by methylprep and the get_sex function. See below for an example of its usage.
[5]:
import methylcheck
from pathlib import Path
filepath = Path('/Users/patriciagirardi/tutorial/GPL21145')
(meth,unmeth) = methylcheck.load(filepath, format='meth_df')
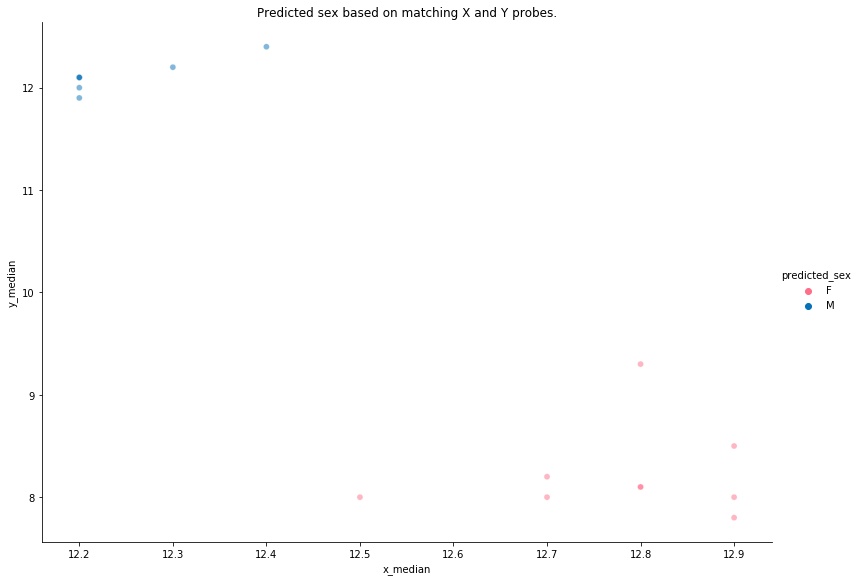
methylcheck.get_sex((meth, unmeth), plot=True)
100%|██████████| 16/16 [00:00<00:00, 491.79it/s]
100%|██████████| 16/16 [00:00<00:00, 1415.80it/s]
INFO:methylcheck.load_processed:(865859, 16) (865859, 16)
INFO:methylprep.files.manifests:Reading manifest file: MethylationEPIC_v-1-0_B4.CoreColumns.csv
WARNING:methylcheck.predict.sex:sample_failure_percent index did not align with output data index
[5]:
| x_median | y_median | predicted_sex | |
|---|---|---|---|
| 203163220027_R01C01 | 12.7 | 8.0 | F |
| 203163220027_R02C01 | 12.3 | 12.2 | M |
| 203163220027_R03C01 | 12.8 | 9.3 | F |
| 203163220027_R04C01 | 12.8 | 8.1 | F |
| 203163220027_R05C01 | 12.2 | 12.0 | M |
| 203163220027_R06C01 | 12.2 | 12.1 | M |
| 203163220027_R07C01 | 12.9 | 8.5 | F |
| 203163220027_R08C01 | 12.7 | 8.2 | F |
| 203175700025_R01C01 | 12.5 | 8.0 | F |
| 203175700025_R02C01 | 12.2 | 12.1 | M |
| 203175700025_R03C01 | 12.9 | 8.0 | F |
| 203175700025_R04C01 | 12.9 | 7.8 | F |
| 203175700025_R05C01 | 12.8 | 8.1 | F |
| 203175700025_R06C01 | 12.2 | 11.9 | M |
| 203175700025_R07C01 | 12.4 | 12.4 | M |
| 203175700025_R08C01 | 12.2 | 12.1 | M |
Darker, smaller markers indicate less variability and a higher confidence in the predicted sex. Our data is pretty clean and has a good separation between the two sexes. It is occasionally the case that some samples will be misclassified. Those warrant further investigation as they are often poor quality samples that should be excluded.
Report PDF tool
This is a fully customizable class template for making more advanced quality control reports. It will call a batch of plotting functions and compile a PDF with annotation and save file to disk.
- kwargs:
filename, poobah_max_percent, pval_cutoff, title, author, subject, keywords, outpath, path
If you want a quick one-line version with no further report editing, try methylcheck.ReportPDF(runme=True). Otherwise, these are the 3 steps for using the ReportPDF class:
[8]:
my_report = methylcheck.ReportPDF(filename='methylcheck_report.pdf',
                                            title="Example Report",
                                            path=filepath)
[9]:
my_report.run_qc()
INFO:methylcheck.reports.qc_report:Data loaded
INFO:methylcheck.reports.qc_report:Beta Density Plot
['203163220027_R01C01', '203163220027_R02C01', '203163220027_R03C01', '203163220027_R05C01', '203163220027_R07C01', '203163220027_R08C01', '203175700025_R01C01', '203175700025_R03C01', '203175700025_R04C01', '203175700025_R05C01', '203175700025_R06C01']
INFO:methylprep.files.manifests:Reading manifest file: MethylationEPIC_v-1-0_B4.CoreColumns.csv
INFO:methylcheck.reports.qc_report:Beta MDS Plot
INFO:methylcheck.reports.qc_report:QC signal intensity plot
WARNING:methylcheck.qc_plot:Your poobah_values.pkl file contains missing values; color coding will be inaccurate.
INFO:methylcheck.reports.qc_report:Control probes
INFO:methylcheck.reports.qc_report:Betas by probe type
INFO:methylprep.files.manifests:Reading manifest file: MethylationEPIC_v-1-0_B4.CoreColumns.csv
[ ]:
# Once everything has been added, you need to close the PDF before you can read it on disk.
my_report.pdf.close()
# look in the path folder for a PDF file called "some_file_name.pdf" -- it will be similar to the charts
# returned by methylprep.run_qc()
You can customize your ReportPDF and even pass in customized tables like this:
# generate report
report = methylcheck.qc_report.ReportPDF(
    path=working.name,
    poobah_max_percent=10,
    pval_cutoff=0.01,
    title='QC Report',
    author='FOXO Biosciences',
    subject="QC Report",
    keywords="methylation array",
    outpath=working.name,
    filename=report_filename,
    poobah=True,
    on_lambda=True,
    custom_tables=custom_tables,
    debug=True,
    order=['beta_density_plot', 'mds', 'auto_qc',
        'M_vs_U', 'qc_signal_intensity', 'controls',
        'probe_types'],
)
report.run_qc()
report.pdf.close()
Notes:
- ‘on_lambda’: if you are running this within an AWS lambda function in the cloud, the default paths of your manifest and other files will change. When True,
on_lambdawill allow you to specify and override paths to your input, output, and manifest files. - ‘path’: where to read files from.
- ‘outpath’: in this example,
working.nameis a pythontempdirfolder in a lambda virtual environment. Everything is processed there but saved by moving to an S3 bucket. - ‘poobah’: whether the QC should run on samples that have failed probes removed (recommended)
- custom_tables: passing in additional tables to the report. See the function’s help for more details (e.g.
help(methylcheck.qc_report.ReportPDF)). - ‘order’: Option to specify the order of charts in the REPORT.